EcoPhi Portal Structure
This page gives you an overview of the EcoPhi Portal structure, including organizations, sub-organizations, sites, data sources, and key navigation areas. It helps you understand how portal elements are related and where to find the most important functions in the interface.
Watch this video to get an overview of how the EcoPhi Portal is structured:
Organization structure
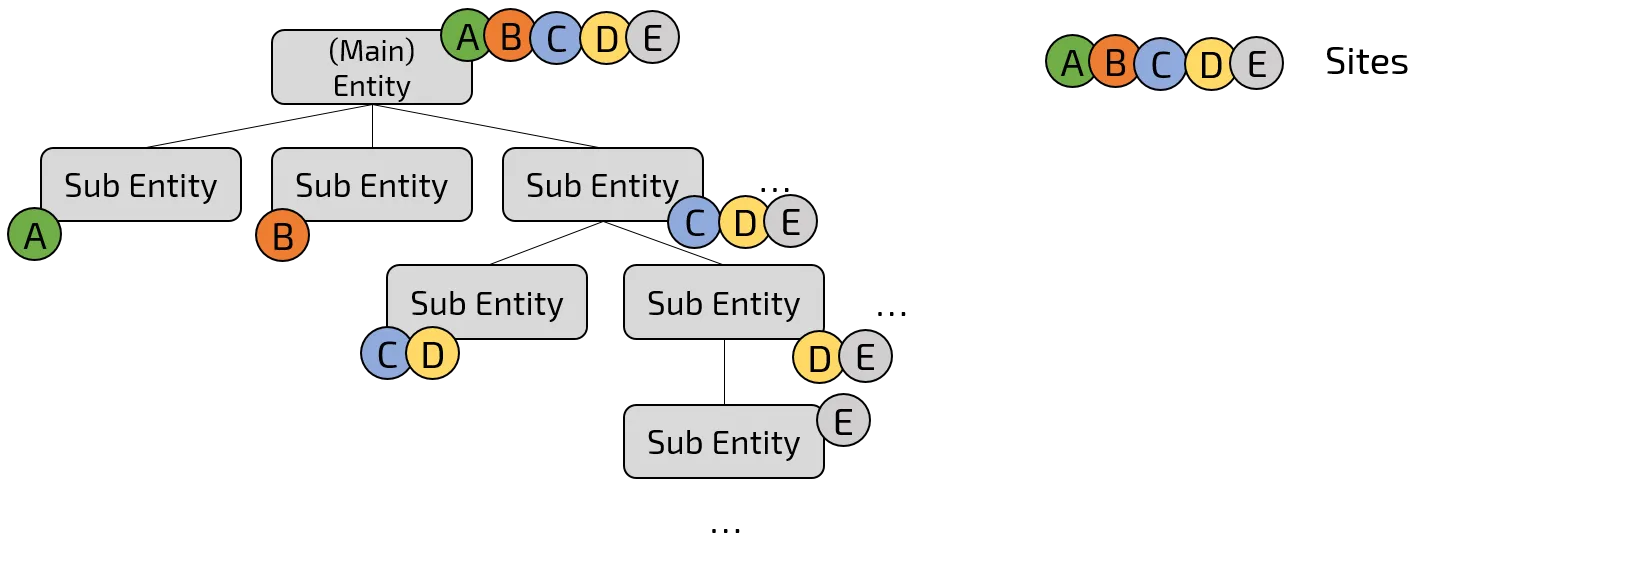
The following image shows how Organizations, Sub-Organizations, and Sites are structured in the EcoPhi Portal.
Site structure
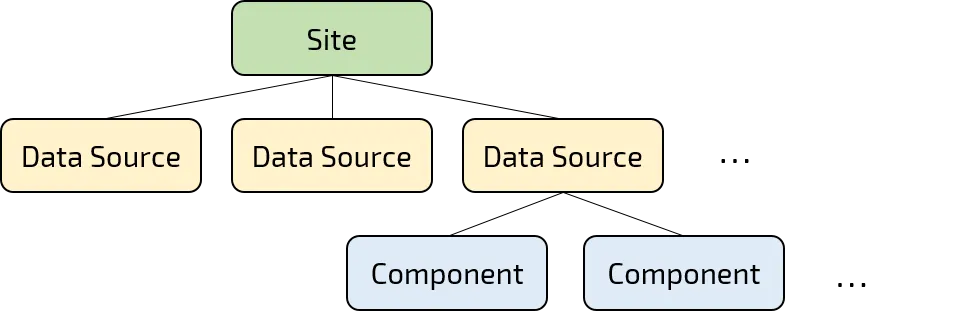
The following image shows how a Site in the EcoPhi Portal is structured.
Organization Levels
Main Organization
- Definition: The Organization represents the top level of the hierarchy. Typically, there is one Organization linked to one EcoPhi customer. Only an Organization can create new Sites.
- Example: A solar company using the EcoPhi platform to monitor and control multiple solar systems and facilities.
- Platform terms: A (Main) Organization using the EcoPhi platform to monitor and control multiple Sites.
Sub-Organization
- Definition: Sub-Organizations are below Organizations in the hierarchy and are used to organize different Sites within the organizational structure. They cannot create new Sites, but they may edit existing Sites if they have permission to do so.
- Example: Different departments, subsidiaries, or end-customers of a company, each operating one or various solar systems.
- Platform terms: Different Sub-Organizations of a (Main) Organization, each operating one or more Sites.
Site
- Definition: Sites represent physical or virtual facilities and systems that aggregate one or various Data Sources. They are the actual locations or systems where data is collected and monitored.
- Example: A production plant, a data center, or a solar farm.
Data Source
- Definition: Data Sources are specific sources of data within a Site. These can either be physical devices like EcoPhi Boxes or APIs that retrieve data from external systems.
- Example: An EcoPhi Box for monitoring energy consumption or an API providing weather data for the Site.
Component
- Definition: Components are physical devices within the Data Source “EcoPhi Device” that provide measurement data.
- Example: An inverter in a solar installation, serial, analog, and digital sensors.
Rules
- (Main-)Organization members see all Sites of the (Main-)Organization.
- Sub-Organization members see all Sites that have been shared with this Sub-Organization.
- A user can be a member of several Organizations and Sub-Organizations at the same time. Users of (Main-)Organizations do not automatically get access to Sub-Organizations and must be added as Sub-Organization members.
Take a look at this video to get a quick idea of the navigation through the portal:
Navigation
Home page
Left navigation bar
The left navigation bar contains links to the most important pages, such as Organization Management, User Management, Dashboards, and Alerts.
Top navigation bar
In the top navigation bar, you can switch Organizations via the Organization Picker, open Account Settings, and change the theme and language.
Sites Overview
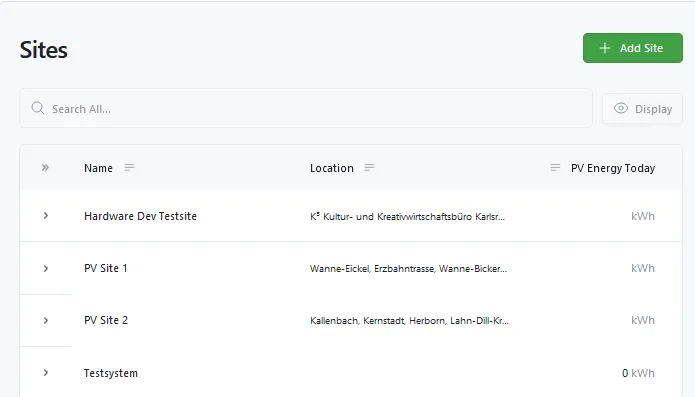
- Here you can find an overview of your Sites.
- Use the search bar to filter your Sites for columns and labels.
- To sort the Sites depending on a column, click on the column heading. To change the sorting order, click again and click one more time to remove the sorting.
- On “Display” you can select which categories and KPIs should be shown as columns on the table.
- To receive more information on a specific Site, click the arrow on the left of the Site row.
- To open a Site, click the row. The Detail View will open. Click the two arrows in the top left of the Detail View, next to the Site name, to switch to full-screen mode.
Site Tabs
Once you have opened a Site from the Sites Overview, you will see the Site Tabs. Depending on your permissions, you may see all or only some of the following tabs:

Overview: Here you can see the Overview Dashboard of your Site. The Overview Dashboards aggregate the data of all Data Sources that belong to the Site.
Details: Shows the dashboards of the Data Sources (the connected EcoPhi Boxes). Here you can see the detailed measurement data of all connected and configured Components.
Data Analyzer: The Data Analyzer is a tool to explore all raw data that is connected to the Site. You can filter for Data Sources and Components and analyze and compare single or different values at the same time.
Action Conditions: If this feature is relevant for your system, you can find all action settings here, such as controls and logic parameters. This tab is only relevant if control functions have been set up for your system. See Action Conditions for more details. Action conditions are always created individually and are documented separately when they are used.
Site Settings: Here you can set up your Site and add Data Sources (EcoPhi Boxes) and Components to the Site.
Top navigation bar
In the top navigation bar, you can switch Organizations via the Organization Picker, open Account Settings, and change the theme and language.

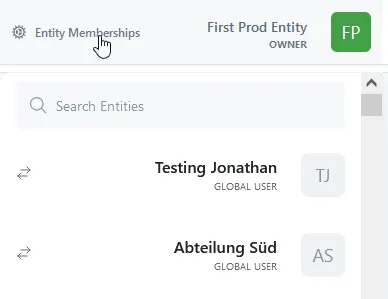
Organization Switcher: Here you can switch to other Organizations of which you are a member. By hovering over the Organization Switcher, you can also go to the Organization Memberships page. Here you can manage all your memberships and react to Organization invites as described in User Management.
Account Settings: Use this area for all account-related settings. See Account Settings.
Theme picker: There are two modes, the dark and the light mode. You can quickly change the mode by clicking on the icon. You can also change the preferred theme in your account settings.
Language picker: Here you can switch the language of the EcoPhi Portal. This affects the general navigation in the portal.