Dashboards
Monitoring Dashboards
Go to “Site Overview” and click the Site to open the Site Detail View.
In Site Details, you can find several tabs for monitoring and analyzing your data.
Overview: Here you can see the overview dashboard of your Site. The Overview dashboards aggregate the data of all Data Sources that belong to the Site.
Details: Shows the dashboards of the Data Sources, for example the connected EcoPhi Boxes. Here you can see the detailed measurement data of all connected and configured Components.
Data Analyzer: Allows you to view and compare all raw measurement data available in the Site. You can select each Data Source and Component and choose one or multiple measurement values.
Watch this video to see how to use the Data Analyzer:
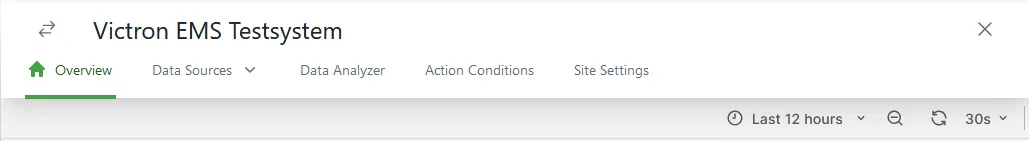
Changing the time range
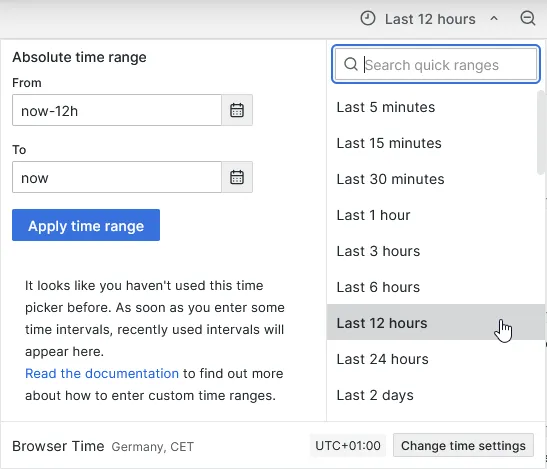
Click on the time picker on the top right.
You can select a pre-defined time range or specify an individual time range. Depending on your location, you can also change the time settings.
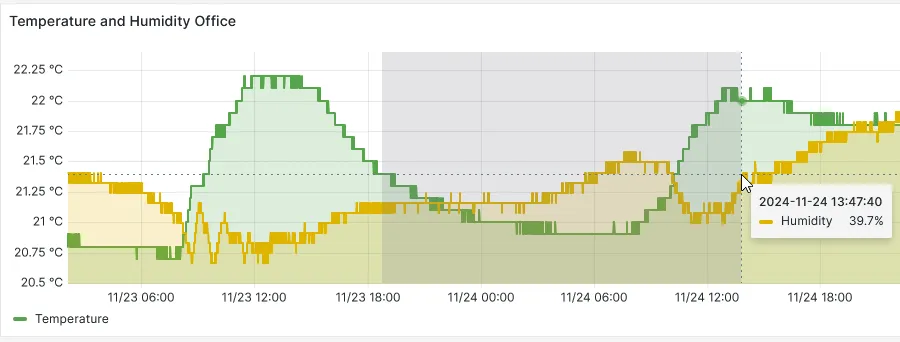
You can also adjust the time range directly within a graph:
- Hover over the graph.
- Press and hold the left mouse button.
- Drag the mouse to highlight the desired time range.
- Release the mouse button to set the new time range.
Update the data
The dashboards load the latest data when they are opened. After that, they do not automatically refresh by default.
To retrieve the latest data, click on the refresh button on the top right.
Show and hide data in a graph
You can select individual values within a graph by clicking their name in the legend. To display a value again, click its name once more.
To select multiple values simultaneously, hold down the Ctrl key, or Cmd on Mac, and click the desired names in the legend.
Update Dashboard Templates
Upon Site and Data Source creation, you can select the template that should be used for your dashboards.
You can also change the template later.
Site: To change a Site Overview Template, go to Site Settings, expand the “Site Information” section, and click the Edit icon. Select the Dashboard Template and update the Site.
Data Source: To change a Data Source Template, go to Site Settings -> “Data Sources” and click the Edit icon for the relevant Data Source. Select the Dashboard Template and update the Data Source.