Troubleshooting
If a system is not working as expected, there can be many possible causes. This chapter describes how to identify the source of a problem and which diagnostic steps are typically useful.
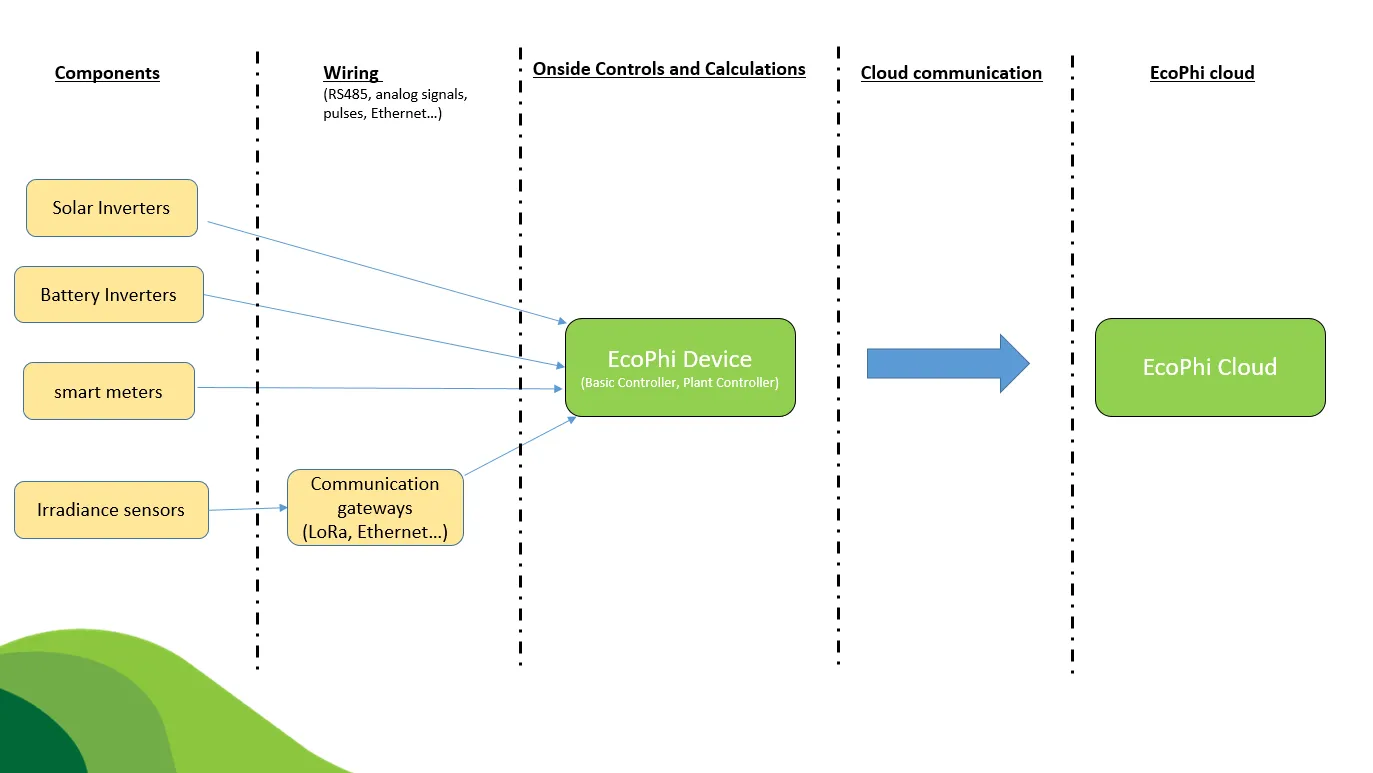
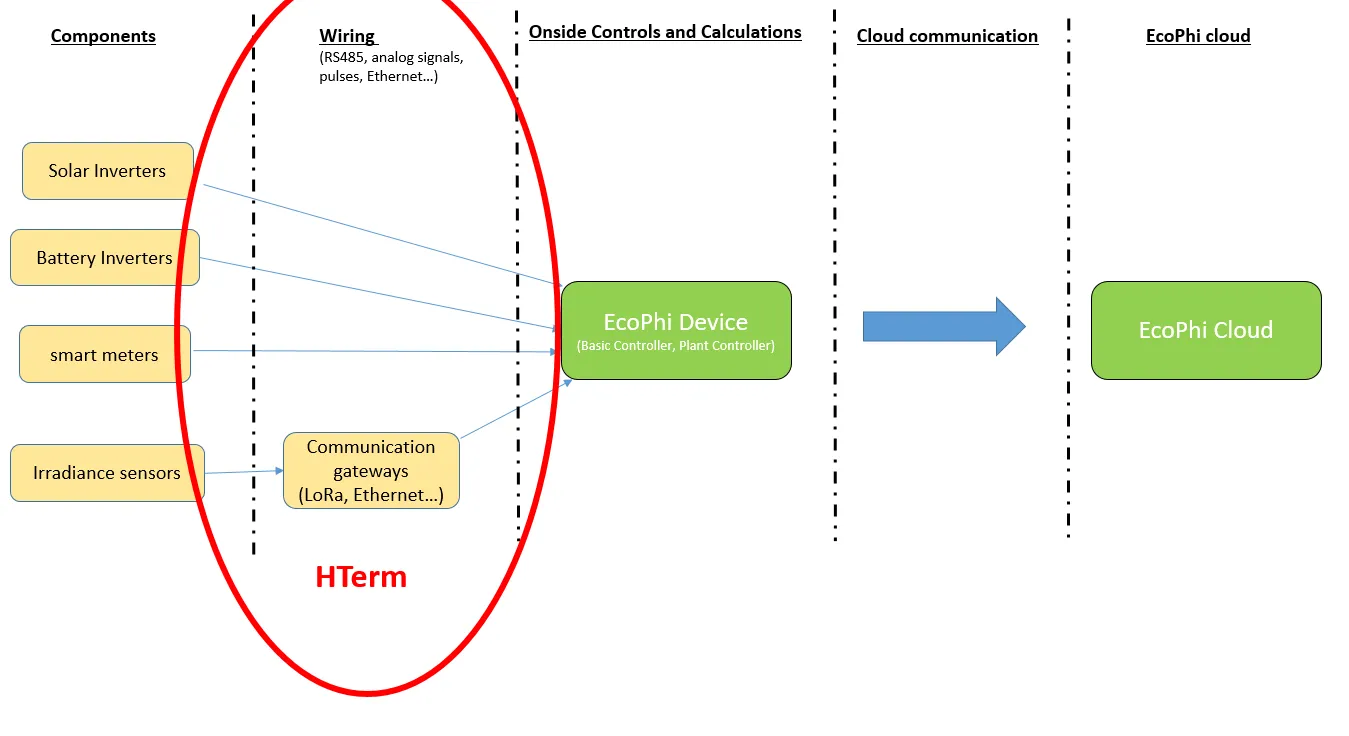
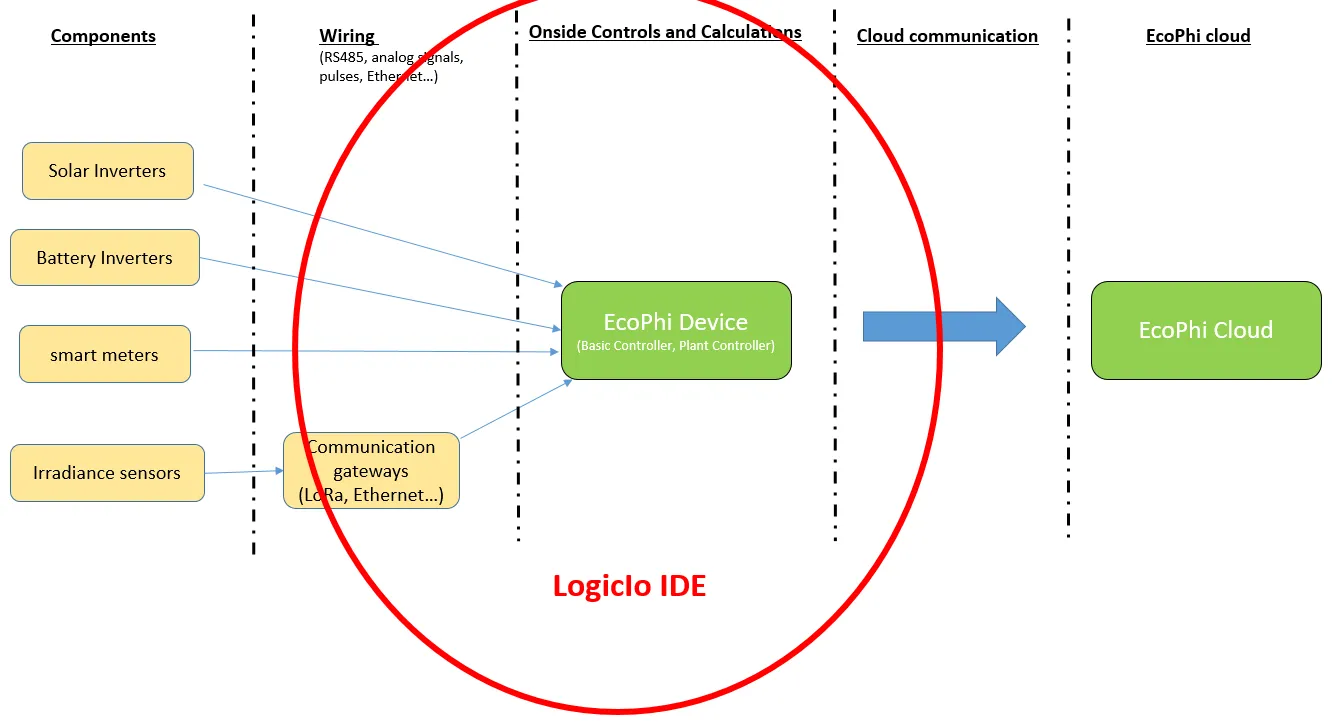
The EcoPhi system consists of several stages, starting with the field components and ending in the EcoPhi Cloud. Depending on where an issue occurs, different tools and methods are appropriate.
As a general rule, start troubleshooting at the beginning of the chain and work step by step toward the controller and the cloud. This approach usually makes it easier to isolate the fault.
The following sections describe the typical troubleshooting steps for each level.
1. Components
The first troubleshooting level concerns field components such as solar inverters, battery inverters, smart meters, and sensors.
Problems at this level are usually related to device configuration, communication settings, or cabling.
For serial communication systems, always verify that the communication parameters match the manufacturer’s protocol specification. Typical parameters include:
- Baud rate
- Data bits
- Parity
- Stop bits
- Slave address
Although communication can be monitored directly on the EcoPhi device through debug messages, dedicated diagnostic tools are often faster and more practical when testing a single device.
Two commonly used tools for this purpose are ModScan32 and Hterm. Both allow direct inspection of the communication between a laptop and the device.
Perform the following checks:
-
Verify that communication with the device can be established.
Connect a laptop to the device using an RS485-to-USB converter and attempt to establish communication.
If communication cannot be established, check:
- wiring
- termination
- communication parameters
- device address
Adjust these settings until communication is possible.
-
Check the stability of the data stream.
Once communication is established, verify that data is transmitted continuously and that there are no interruptions or timeouts.
-
Verify that the data matches the communication protocol.
Compare the received values with the device’s protocol documentation to confirm that the registers, offsets, and scaling factors are correct.
-
Compare the results with the values on the EcoPhi device.
Verify that the same values are visible on the EcoPhi device.
If the laptop receives correct data but EcoPhi does not, the issue is most likely related to configuration or wiring between the component and the controller.
2. Wiring
The second troubleshooting level concerns the physical wiring between the components and the EcoPhi device.
All wiring rules described in the relevant device manuals should be followed carefully. This includes polarity, shielding, grounding, and termination.
If communication gateways are used, for example LoRa or Ethernet gateways, their configuration and wiring should also be checked against the relevant manuals.
Two key questions should be answered:
- Is EcoPhi sending requests?
- Are the devices responding?
A quick way to check this is to observe the communication LEDs on the distribution boards.
The distribution boards include LEDs that blink for approximately 1 to 2 seconds whenever communication occurs. This provides a quick indication of communication activity.
If no activity is visible, the cause may be an incorrect configuration or a hardware issue. If requests are visible but no responses occur, the problem is likely on the device side or in the wiring.
3. Onsite Controls and Calculations
The third troubleshooting level concerns the internal operation of the EcoPhi device itself.
To analyze this layer, connect to the device and review the debug messages. Different message categories provide information about specific functions.
Important message categories include:
700,701: Periodic readouts and results of device communication500,501,502,503: Detailed information about communication with connected componentsStandard Flash Index 16-143: Configuration parameters of individual components080-093: States and parameters of the Energy Management System (EMS)050-079: Internal states of device-specific logic processes101,102,104: Status of cloud communication
If prc = 0, communication with the cloud is working correctly. Any other value indicates a communication problem.
These debug messages usually make it possible to determine whether the device is communicating correctly with field components and whether the internal logic is operating as expected.
4. Tools
ModScan32
ModScan32 is typically used in the early stages of troubleshooting to test communication with Modbus devices directly.
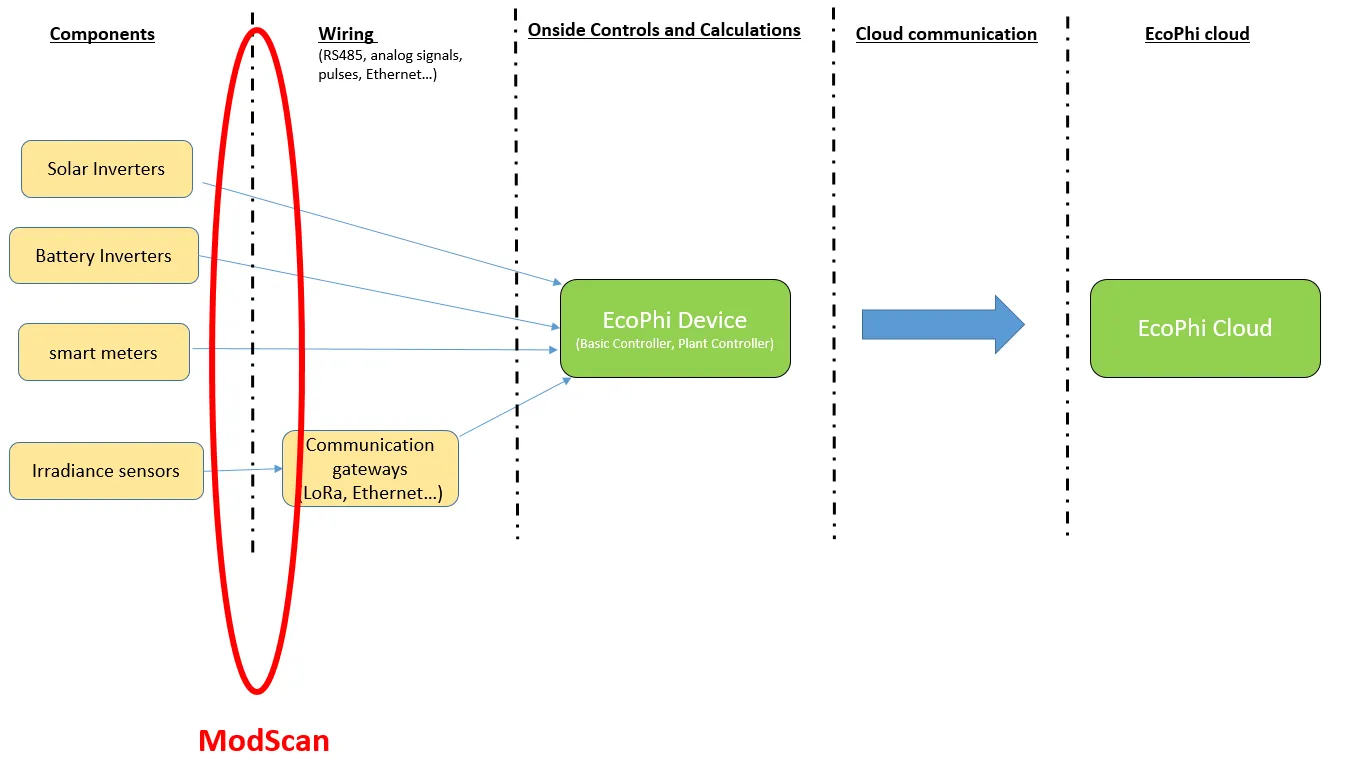
In this setup, the laptop acts as the Modbus master and sends requests to the Modbus slave device. A USB-to-RS485 converter is required.
Download: https://www.win-tech.com/html/modscan32.htm
If the software is not licensed, it must be restarted every three minutes.
After starting the program, select Connection -> Connect.
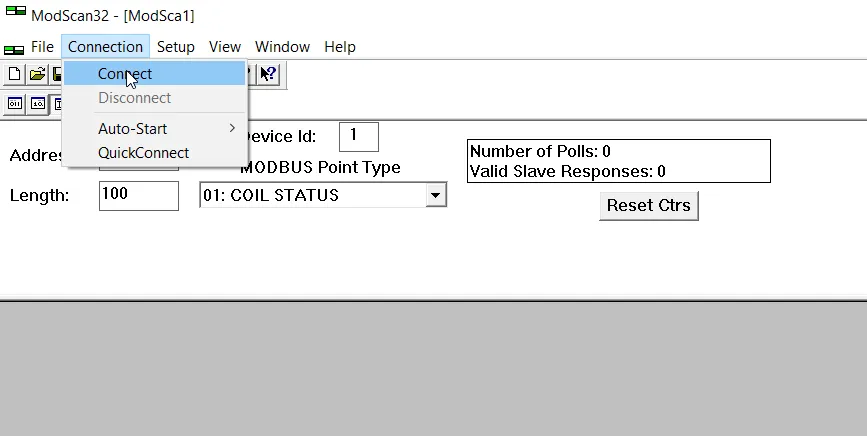
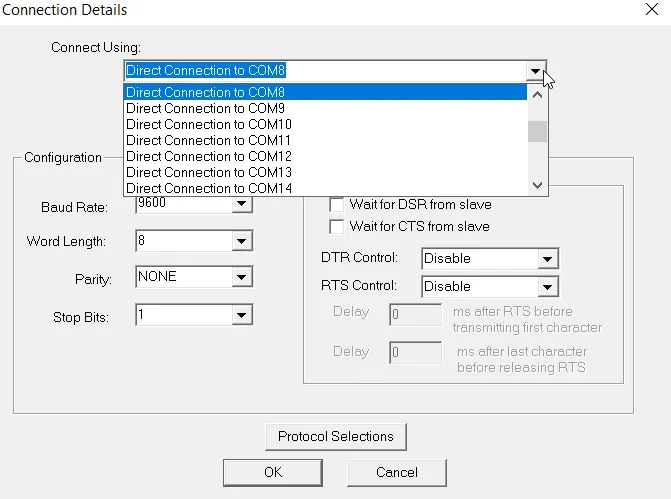
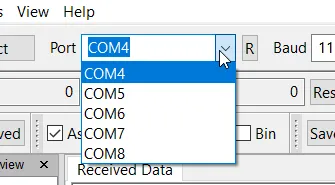
Then choose the COM port of the RS485-to-USB converter.
The correct COM port can be identified either in the Windows Device Manager or by using Hterm.
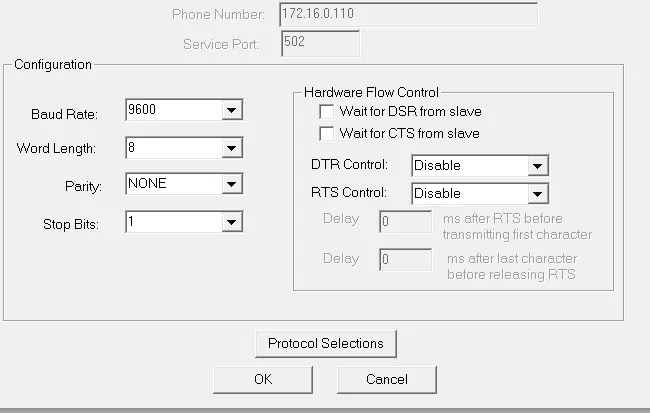
Next, configure the Modbus parameters. In many installations, the settings are typically:
- Baud rate: 9600
- Data bits: 8
- Parity: None
- Stop bits: 1
These settings always depend on the communication protocol of the device.
After configuration, the raw register data appears in the lower window.
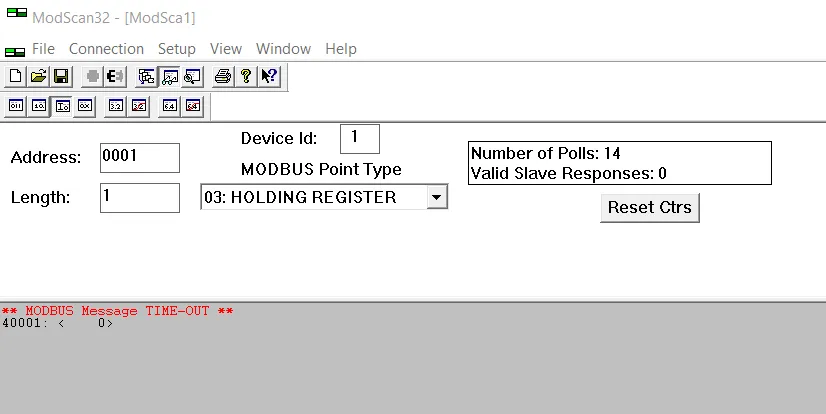
Two counters provide useful diagnostic information:
Number of Polls: Shows how many requests have been sentValid Slave Responses: Shows how many valid responses have been received
A high number of valid responses indicates that the communication path and wiring are functioning correctly.
Hterm
Hterm is another useful tool for analyzing serial communication.
The communication parameters should be configured in the same way as in ModScan.
Hterm automatically lists the available COM ports and allows you to connect to the correct one.
Once connected, the software displays the complete serial data stream.
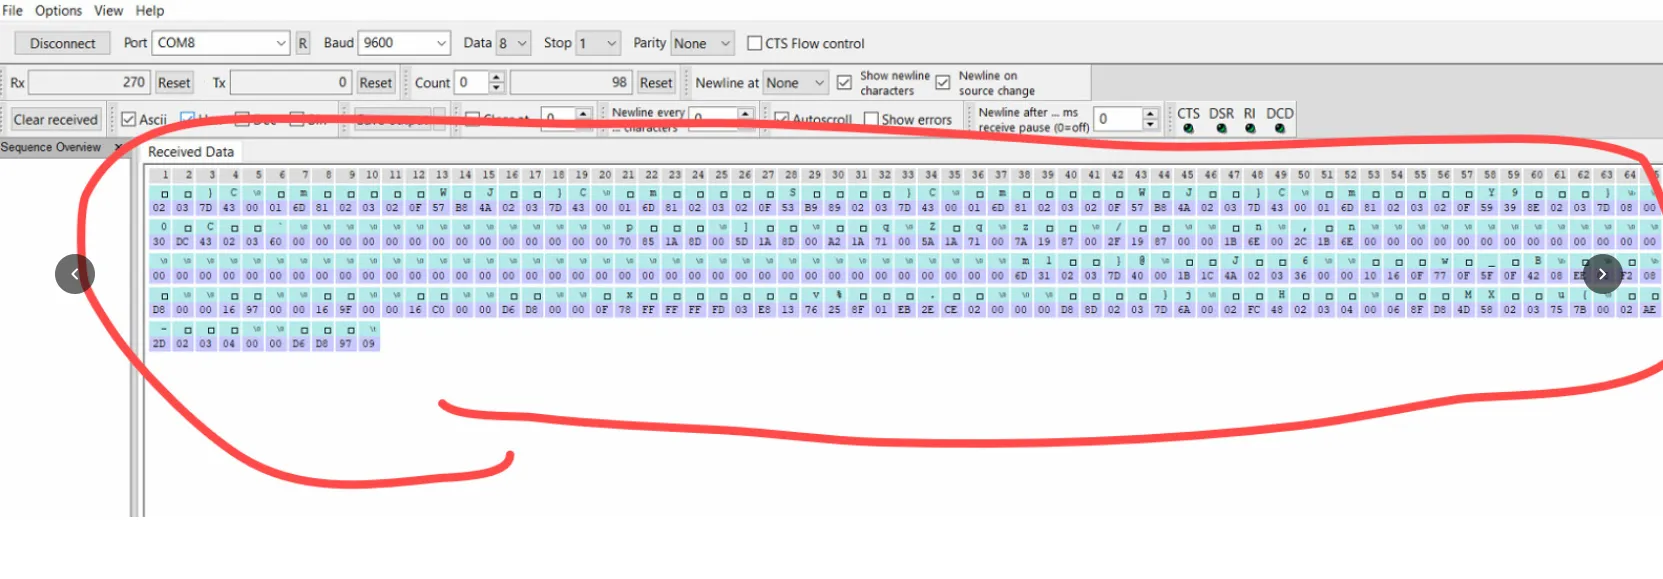
Unlike ModScan, Hterm operates passively. It does not send its own requests but instead monitors the existing communication on the bus.
This allows both the requests sent by EcoPhi and the responses from the components to be displayed and analyzed.
Another advantage is that Hterm also shows invalid or corrupted messages. This makes it possible to identify issues such as:
- incorrect baud rate
- wiring problems
- communication collisions
- corrupted messages
These issues can be difficult to identify with active polling tools alone.
LogicIO IDE
The LogicIO IDE is the main tool for local access to an EcoPhi device. It allows users to connect directly to the controller, monitor debug messages, change configuration parameters, execute commands, and analyze system behavior.
Download: https://logicio.com/files/RTCU%20IDE%20V9.97.msi
Check the download section on logicio.com for newer versions of the IDE.
5. LogicIO IDE Details
The LogicIO IDE was originally developed as a programming tool. However, it is also very useful for troubleshooting, even when no coding is required.
Although it is more complex than some of the other tools, it provides the deepest level of insight into the EcoPhi system.
The EcoPhi device can be connected to a laptop using a Mini-USB cable.
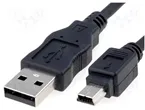
Procedure:
- Connect the laptop to the EcoPhi device using the USB cable.
- Start the LogicIO IDE.
- Wait until the IDE detects the connected device.
Once the connection is established, several device parameters can be inspected directly in the interface, including:
- Internet connection status
- Ethernet settings
- Sensor information
- General device information
![]()
These parameters provide a quick overview of the system state and help verify that the device is operating correctly.
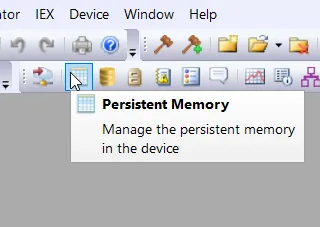
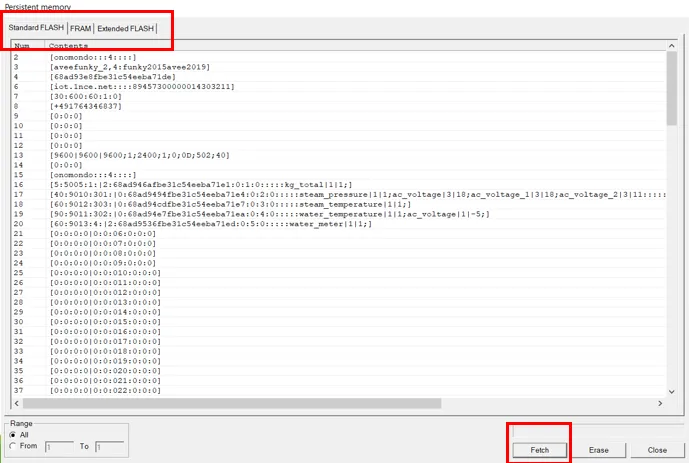
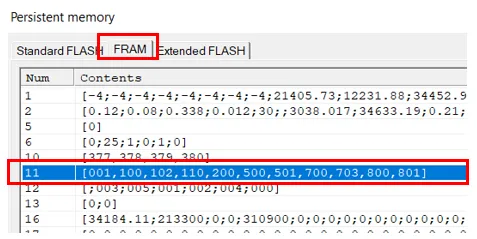
Persistent Memory: Flash and FRAM
The EcoPhi device uses persistent memory to store configuration parameters and process values. This memory is divided into three main sections.
Standard Flash
Standard Flash is used for parameters that rarely change, such as device configuration settings. It allows approximately 100,000 write cycles and should therefore not be used for frequently changing values.
FRAM
FRAM is designed for parameters that change frequently during operation. It allows virtually unlimited write cycles and is therefore suitable for runtime values, status flags, and debug settings.
Extended Flash
Extended Flash provides additional memory space that can be used for configuration data or custom readout definitions.
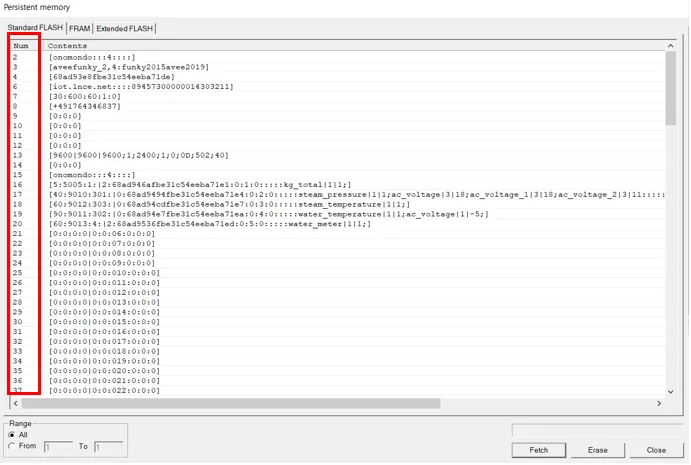
Each entry in the persistent memory is addressed using a numeric index. The meaning of these indices is defined in the corresponding memory mapping documentation.
Typical uses of persistent memory include:
- configuration parameters
- activation of debug messages
- parameters for control logic
- communication settings
Additional notes:
- Standard Flash is intended for values that rarely change
- FRAM is intended for values that change frequently
- Each entry is identified by a numeric index
- The meaning of the entries is described in
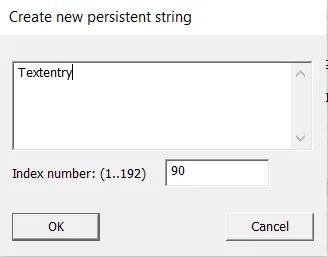
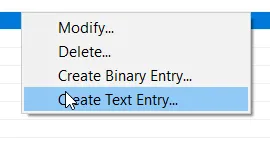
RTCU Memory Mappings v1.6 _for external users - New entries can be created with right-click and
Create Text Entry, if required
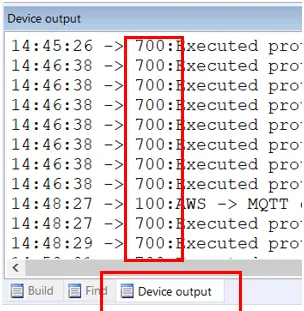
Reading Debug Messages
The Device Output window in the LogicIO IDE displays the debug messages generated by the EcoPhi device. These messages are one of the most important tools for diagnosing system behavior.
Each message is identified by a three-digit debug ID. Every ID corresponds to a specific process or subsystem within the controller.
Examples of important debug messages include:
| Debug ID | Description |
|---|---|
| 101 | Data sent to the cloud |
| 102 | Messages received from the cloud |
| 501 | Serial communication issues |
| 700 | Component readouts |
| 701 | Details of serial readouts |
| 702 | Details of analog inputs |
| 703 | Details of digital inputs |
| 800 | Internet connection status |
For systems using an Energy Management System (EMS), the following debug messages are particularly useful:
| Debug ID | Description |
|---|---|
| 080 | Grid input measured in each control cycle |
| 081 | PV production and control |
| 082 | Battery production and control |
| 088 | Detailed inverter information |
| 089 | Detailed smart meter information |
Activating Debug Messages
The debug messages displayed by the system are configured through FRAM Index 11.
Write the desired debug IDs into this entry. For example:
700,701,501
The separator between the numbers must be ,.
If required, debug messages can also be stored on the SD card by writing the debug IDs to FRAM Index 10. This allows later analysis of historical system behavior, but may slightly increase system load.
A complete description of the debug messages can be found in RTCU Memory Mappings v1.6.xlsx.
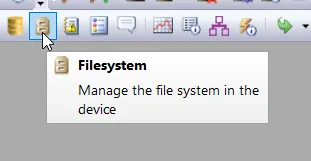
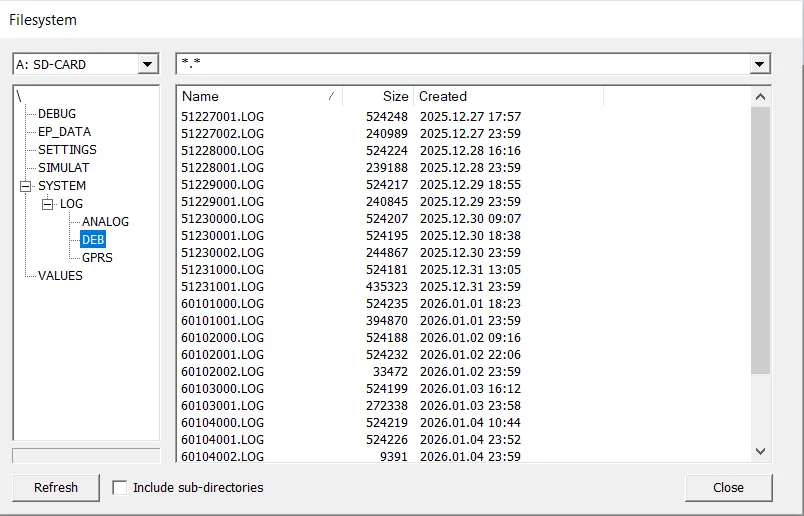
Accessing Log Files
The LogicIO IDE provides a file system browser that allows access to files stored on the device.
Of particular interest is the directory:
system/log/deb
This directory contains debug logs from previous days. These files can be downloaded for further analysis.
Log files are especially useful when troubleshooting intermittent issues or analyzing system behavior over a longer period of time.
Executing Manual Commands
The EcoPhi device supports the execution of manual diagnostic commands through the persistent memory.
Commands can be written into:
Standard Flash Index 161
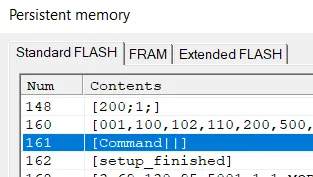
The command must be placed after the keyword:
Command||
Example:
Command||ping;2;192.168.1.105
Once the entry is written, the device executes the command automatically. The result then appears in the debug messages, typically in message IDs 101 or 102.
Manual commands are often used to:
- test communication with specific components
- execute Modbus requests
- trigger diagnostic routines
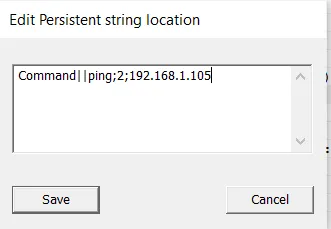
Activating the Energy Management System (EMS)
The Energy Management System (EMS) can be started manually via the persistent memory.
To activate the EMS, set:
Standard Flash Index 183 = 1
Once activated, the controller immediately begins its control cycles.
During EMS operation, it is recommended to observe the following debug messages:
084: List of components used by the EMS080: Grid input for each cycle081: PV control information082: Battery control information088: Detailed inverter data089: Detailed smart meter data
These debug messages provide a detailed overview of EMS operation and allow quick identification of configuration or communication issues.
Logicblocks
Many EcoPhi devices operate with custom control logic, often referred to as Logicblocks. These logicblocks define how the device processes sensor data, evaluates conditions, and controls connected components.
Logicblocks are typically used to implement functions such as:
- device control logic
- automation processes
- system protection mechanisms
- project-specific control behavior
Because different projects require different control strategies, the logic running on the device can vary between installations.
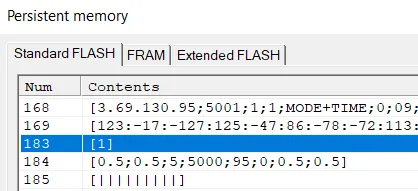
Activating a Logicblock
Logicblocks are activated through the persistent memory.
To start a logicblock, write the corresponding identifier to:
FRAM Index 90
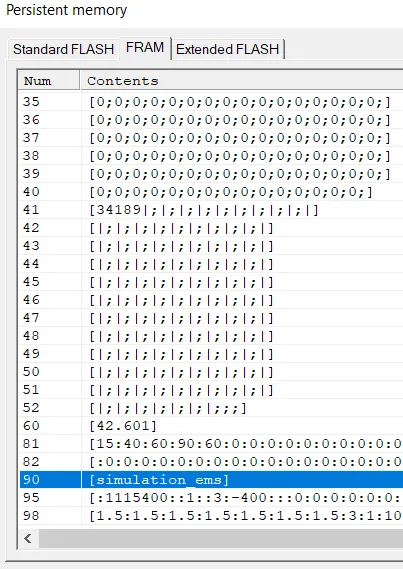
Once this value is set, the device loads and starts the selected logic. After activation, the control logic runs as part of the device’s normal operating cycle.
Logicblock Parameters
After a logicblock is started, additional parameters are usually stored in:
FRAM Index 91 - 100
These entries are typically used to store logic-specific data such as:
- thresholds
- control parameters
- temporary runtime values
- configuration settings for the logic
The exact meaning of these parameters depends on the specific logic implementation used in the project.
Monitoring Logic Operation
The behavior of logicblocks can be monitored through debug messages. Several debug message groups are commonly used to observe the internal state of the logic and its decision processes.
These messages provide information about:
- current logic states
- evaluated conditions
- control decisions
- interactions with connected components
When troubleshooting system behavior, it is useful to enable the debug messages related to the logic and observe how the device processes incoming data and control rules.